Early Versions of CTisus.com
One of our RSNA exhibits in 1998 became the first web-based application that we would produce. It was entitled "3D Vascular Atlas with Volume Rendering" (Figure 2). This exhibit was the entirety of CTisus in 1999 when CTisus went online. Going forward, the basic format of the site would consist of many stand-alone sections like the vascular atlas, each containing case studies and teaching files (with images), protocols, syllabus, and lecture sections.
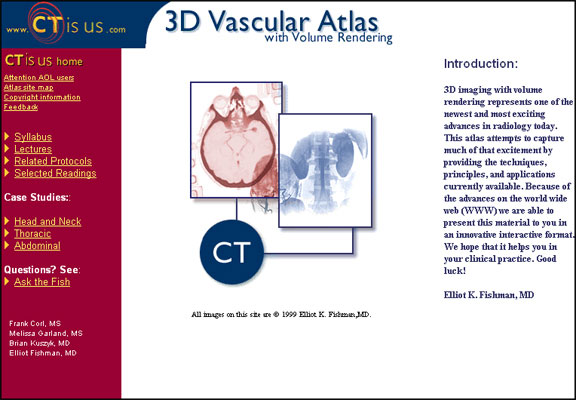
Figure 2: Screen shot of the "3D Vascular Atlas with Volume Rendering" exhibit at RSNA 1998 after it was adapted for the CTisus.com web site in 1999.
Images, Text Content, and Teaching Files
Much attention was given to making the images on this early version of CTisus.com as small in file size as possible, due to the bandwith restraints of the internet at the time. Teaching file images were saved at a maximum of 320 pixels in the widest dimension at a screen resolution of 72 dots per inch (dpi). Medium quality jpeg compression was also used to further reduce the image size, sometimes resulting in a loss of image quality (Figure 3).
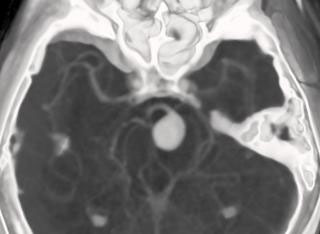
Figure 3: Note the loss of image quality in this early image from CTisus.com. The image is 320 pixels wide in its largest dimension.
The HTML (hypertext markup language) pages of the web site were hand coded in a text editor, such as Bare Bones Software BBEdit (Bare Bones Software, Bedford, MA) or Microsoft Wordpad (Microsoft, Redmond, WA) using a version of HTML 4.0 and incorporated the use of frames. This was done to keep the navigation of the site in a stationary spot on the right of the page no matter which page on the site a user visited (Figure 4) and to enable updating of the navigation without making subsequent changes to multiple pages.
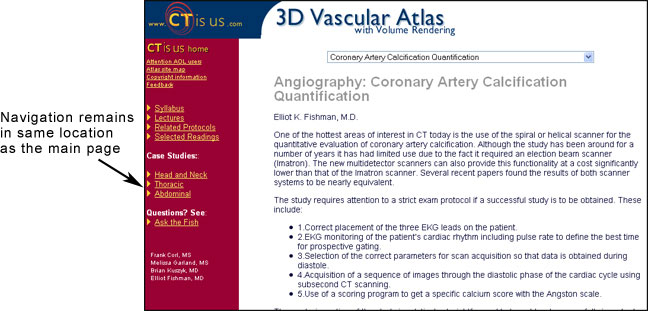
Figure 4: Designing the early site using frames made updating navigational elements easy.
In the absence of using an image database to house the images on CTisus, we created a JavaScript application to generate flash card-type teaching files (Figure 5).
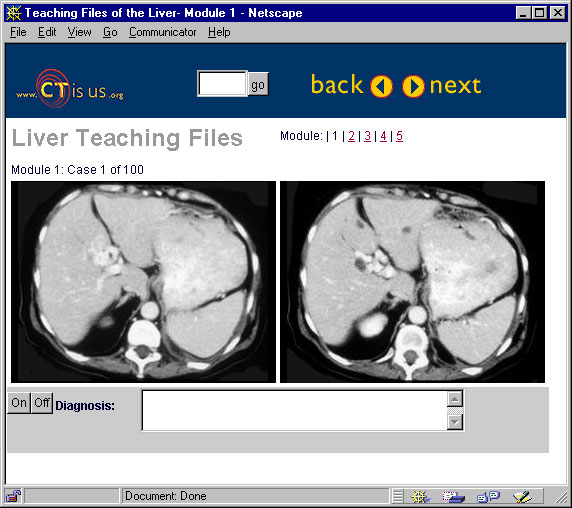
Figure 5: Flash card- style teaching file.
Audio and Video
Audio and video lectures were introduced to the site in 2005. The first lectures that we produced used RealAudio and RealVideo (Figure 6) which were proprietary file formats developed by RealNetworks, Inc (Seattle, WA). Developers were able to use a proprietary (free) program called RealSlideshow to create audio and image synchronized slideshows that could then be streamed by the end user. Since the files downloaded as if they were playing, the presentations were often interrupted and were only as fast as the user's internet connection. Another problem with this format is that the users were forced to download software from RealNetworks in order to view the materials we produced and proprietary software also had to be installed on the CTisus server in order to allow users to view the lectures.
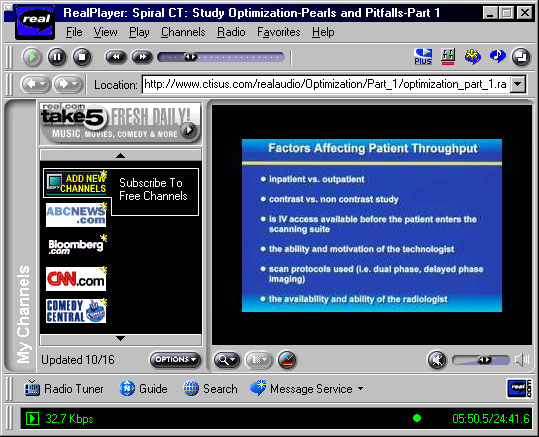
Figure 6: The RealPlayer interface, which was used to stream slideshow lectures. This was the first video lecture delivery format that we used on CTisus.com.
In 2005, we started to record lectures as MP3 files and present them as podcasts (Figure 7). In 2006 we added MP4 files to this and presented video podcasts as well. This format was superior to RealNetworks formats in that the content could be viewed on a wide variety of devices without special software required for installation on a web server in order for users to view it.
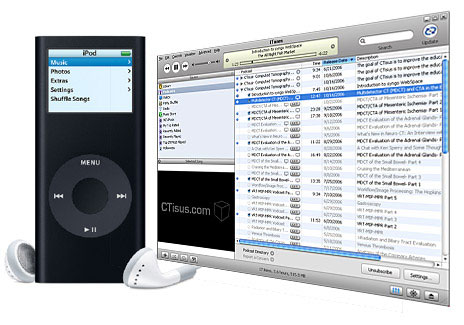
Figure 7: Podcasting uses .mp3 and.mp4 files. By subscribing to the CTisus.com RSS feed, our users were able to have content delivered directly to their devices.
Problems and Pitfalls
The early versions of CTisus had no search feature, and this often made it difficult to find all text and images in a given subject in one place on the site. Several sections of the site contained similar or identical information. The site continued to grow organically with new sections and teaching files being added on a continual basis and the process of putting this information online was not streamlined. The coherence of the graphic design was lost in many sections of the site as the site grew larger.
Workflow
The work flow of creating the teaching files in the site has also changed significantly over the years. In 1999, radiology images were not digitized and archived as they are now. Most CT images were hard copies on film or slides. To make use of CT images on CTisus, slides were scanned (digitized) and the scanned images renamed, resized, and incorporated onto a web page. The workflow involved in creating teaching files on the earliest version of CTisus is illustrated in Figure 8. Resizing and renaming large numbers of images proved to be a time-consuming issue, so software such as Equilibrium DeBabelizer (Equilibrium, Sausalito, CA) were used to batch process them. By 2002, most CT images were archived in digital format, greatly reducing the time involved in processing them for presentation on the web.
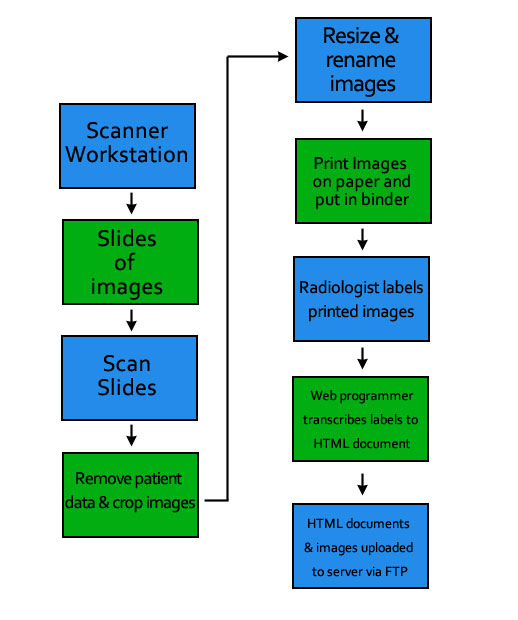
Figure 8: The earliest workflow process involved in creating teaching files for CTisus.com involved scanning slides, printing them out, and labelling them by hand. Margin for error is introduced when a web programmer transcribes the diagnosis that the radiologist has written into the HTML document.